Getting started
1. Machine-specific and project configs
Configuration is split across two files: one machine-specific and one project-specific.
machine_specific_paths.toml — lives in the toolbox root, contains machine-level paths. Generate it with make create_machine_specifics:
# Where to find your conda (miniconda or anaconda) installation as absolute path (str)
conda_path = 'path/to/your/conda'

hugging_face_token = ''
Hugging Face token is empty by default. It’s required for some of the gated models. Check installation instructions for more info.
nice_project.toml — lives in your project folder, contains project-level paths. It is generated with make create_project:
# Path to the directory in which all configuration files are stored
configs_folder_path = '<project_folder_path>/configs'

# Path to the directory in which all datasets are stored
datasets_folder_path = '../datasets'

# Directory for saving toolbox output
output_folder_path = '../outputs'
Adjust datasets_folder_path and output_folder_path as needed for your setup.
2. Example dataset
We provide an example dataset called communication_multiview to demonstrate the NICE Toolbox’s capabilities. Please find it in the datasets folder specified above.
3. Check the dataset’s properties
Ensure that ./configs/dataset_properties.toml contains the following dictionary:
[communication_multiview]
session_IDs = [""]
sequence_IDs = ["sequence_xyz"]
cam_front = "view_center"
cam_top = "view_top"
cam_face1 = "view_left"
cam_face2 = "view_right"
subjects_descr = ["person_left", "person_right"]
cam_sees_subjects = {view_center = [0, 1], view_top = [0, 1], view_left = [0], view_right = [1]}

path_to_calibrations = "<datasets_folder_path>/communication_multiview/calibrations.npz"
data_input_folder = "<datasets_folder_path>/communication_multiview/<cur_sequence_ID>"
start_frame_index = 0
fps = 30
A detailed description of this file can be found in the wiki page on config files under dataset properties.
4. Add an experiment to run
To run the NICE toolbox on the dataset, we need to specify what exactly we want to run in our experiment. Open ./configs/detectors_run_file.toml and ensure that the [run] dictionary includes the following:
algorithms = ["hrnetw48", "vitpose_huge", "velocity_body"]

[run]
[run.communication_multiview]
videos = [
   {session_ID = "session_xyz", sequence_ID='', video_start = 0, video_length = 99},
]
More details can be found in the wiki page on config files under run file.
5. Run the NICE Toolbox
To run the toolbox, open a terminal and execute:
# navigate to the NICE toolbox source code folder
cd /path/to/nicetoolbox/

# LINUX: activate the environment
source ./envs/nicetoolbox/bin/activate

# WINDOWS: activate the environment TODO: update
envs\nicetoolbox\Scripts\activate

# run the toolbox
run_detectors
The outputs will be saved in the folder defined in ./configs/detectors_run_file.toml under io.out_folder (with filled-in placeholders).
To monitor the experiment, check the log file at /path/to/<out_folder>/nicetoolbox.log.
6. Visualize the results
There are multiple options to visualize the results of NICE toolbox.
For an interactive experience, we recommend using our visualizer code, which runs rerun.
To do so, open ./configs/visualizer_config.toml and update the entries io.experiment_folder, io.dataset_name, and io.video_name.
[io]
dataset_folder = "<datasets_folder_path>"
dataset_name = 'communication_multiview'
video_name = 'communication_multiview__sequence_xyz_s0_l-1'
nice_tool_input_folder = "<output_folder_path>/nicetoolbox_input/<cur_dataset_name>_<cur_session_ID>_<cur_sequence_ID>"
nice_tool_output_folder = "<output_folder_path>/experiments"
experiment_folder = "<output_folder_path>/experiments/<yyyymmdd>"
experiment_video_folder = "<experiment_folder>/<video_name>"
experiment_video_component = "<experiment_video_folder>/<cur_component_name>"
A detailed description of visualizer configuration can be found in the wiki page on config files under visualizer config.
Finally, from the top level of your code folder, start the visualizer by running
# activate the python environment if not already activated
source ./envs/nicetoolbox/bin/activate # LINUX
envs\nicetoolbox\Scripts\activate # WINDOWS
# run the visualizer
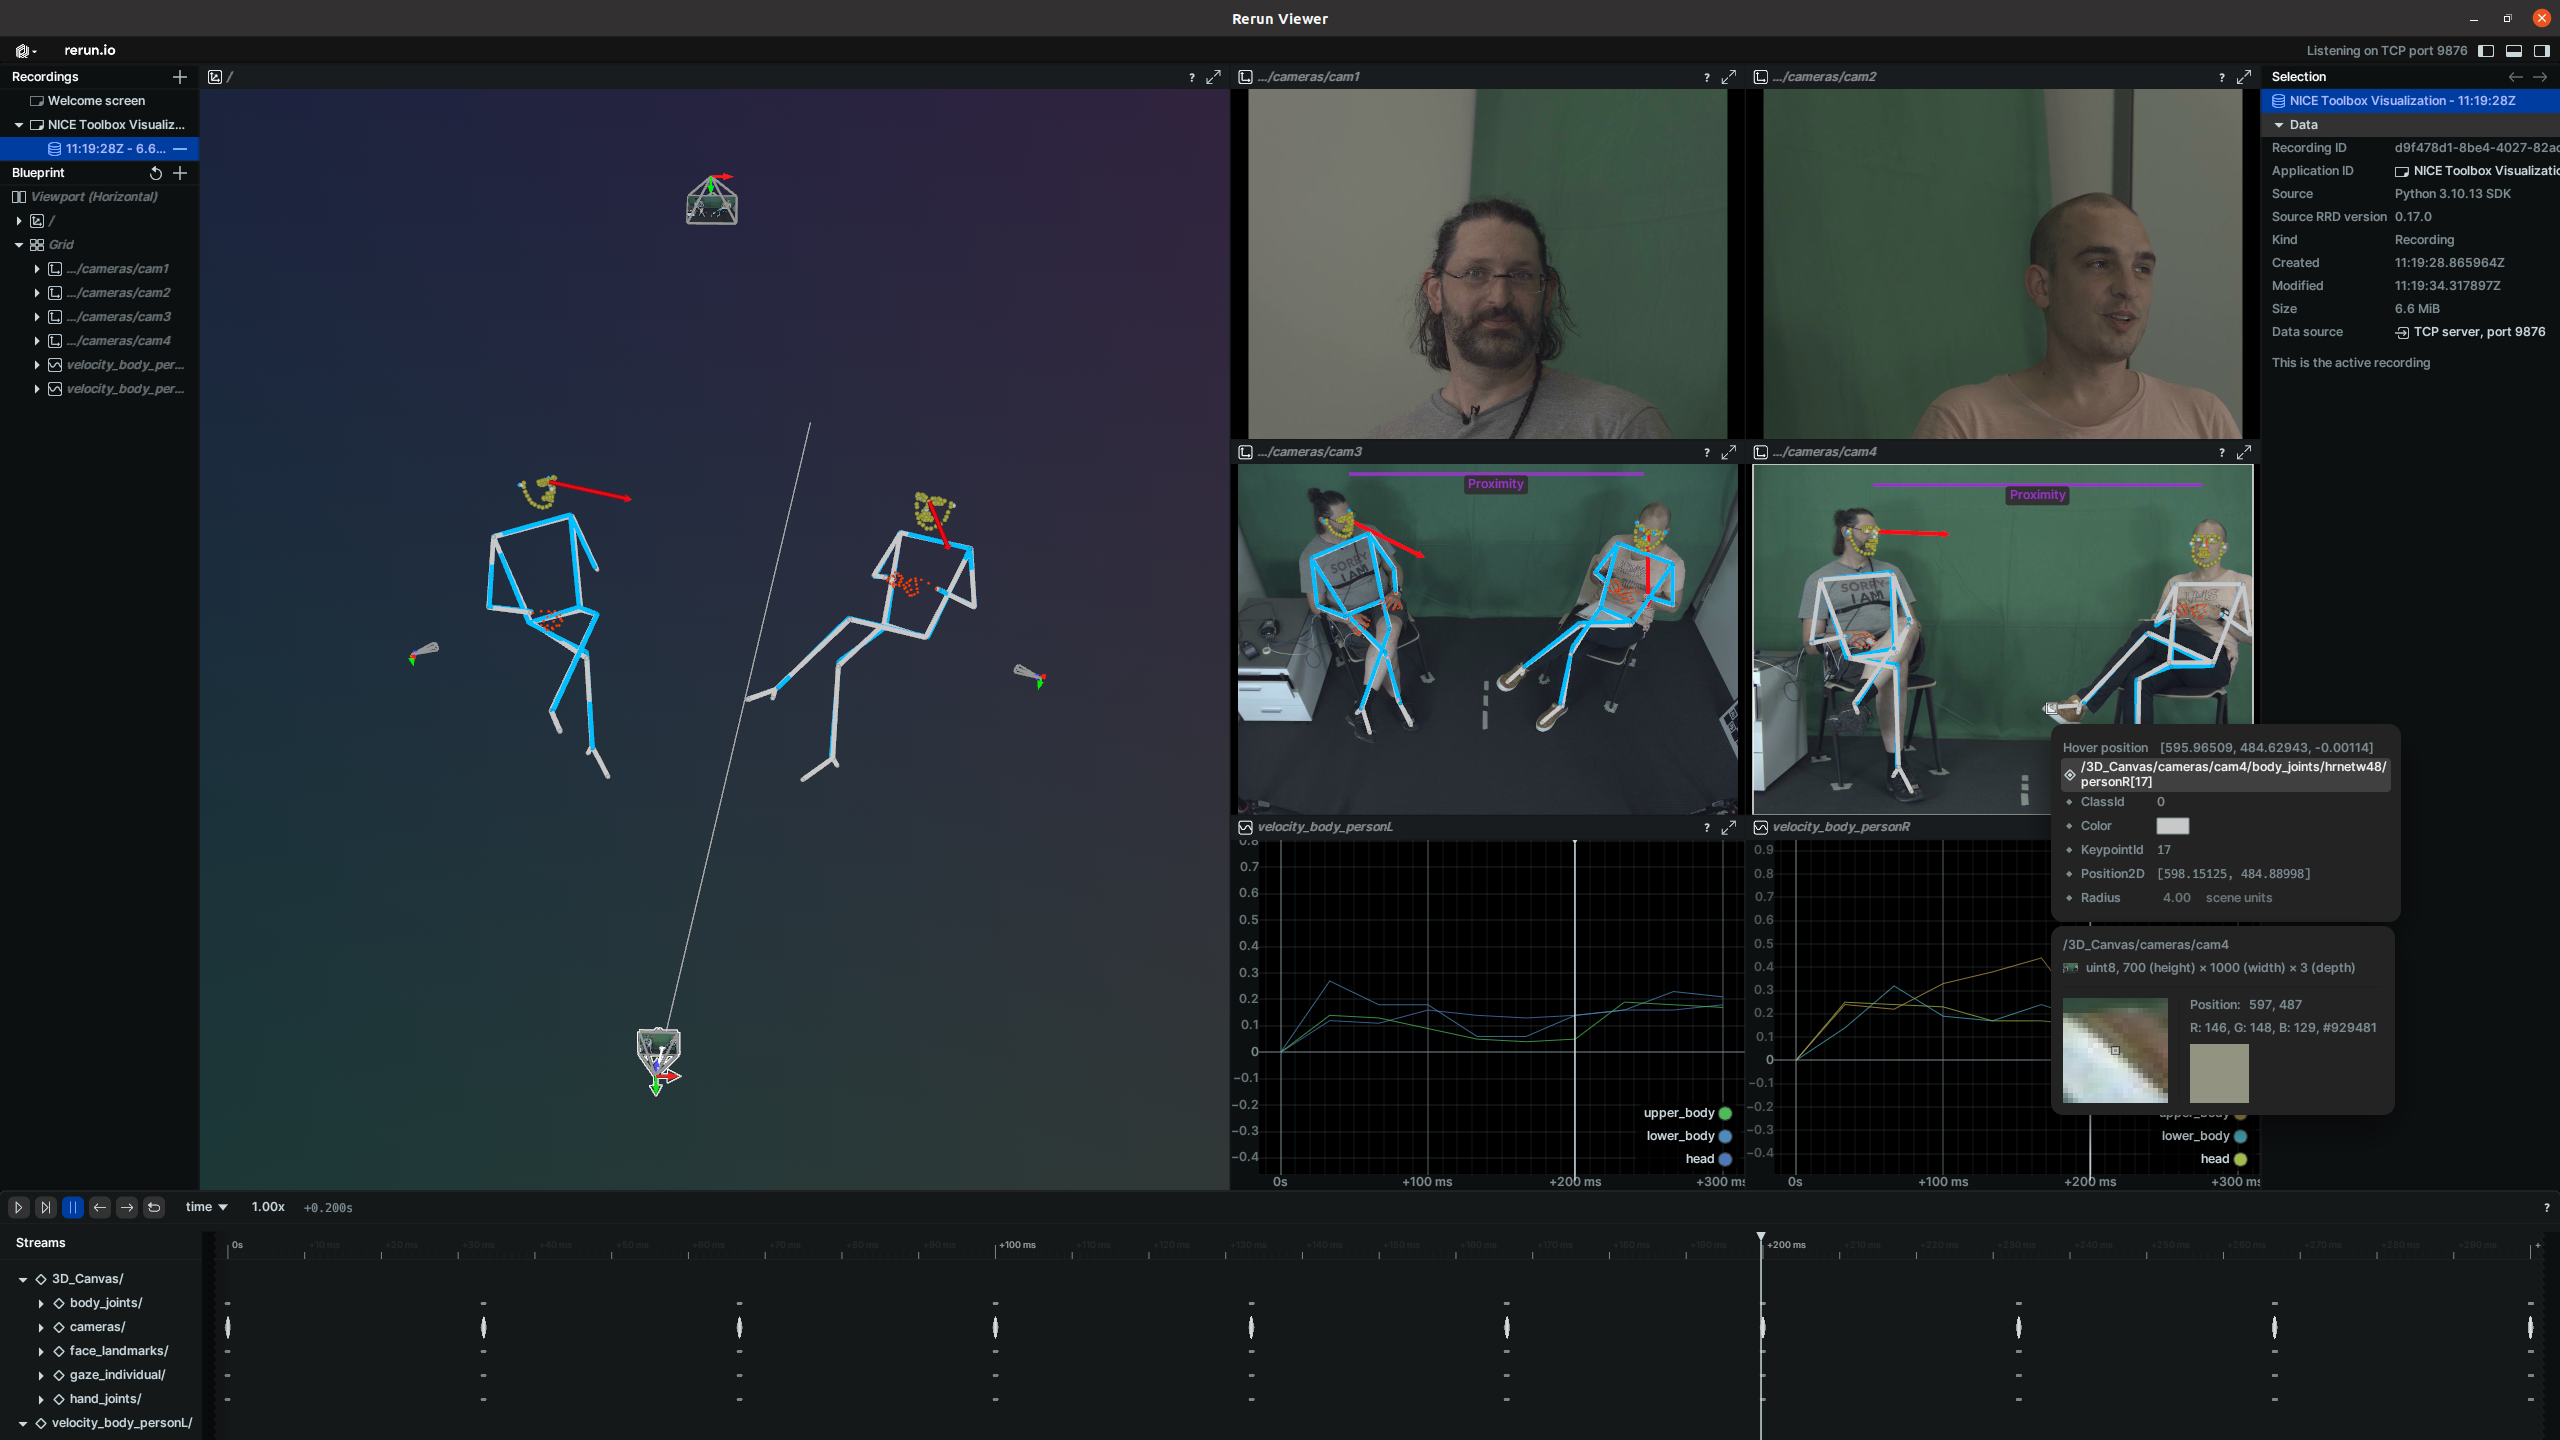
run_visualization
It will open a window which looks similar to this:
7. Run the NICE Toolbox Evaluation
While doing research, you often would like to check the quality and consistency of NICE Toolbox output. We can run an evaluation pipeline to generate additional metrics reports for your data (with and without ground truth annotations). The results can be used to tune specific detector parameters, relevant for your domain.
To run the evaluation of the NICE Toolbox on the example dataset, open a terminal and execute:
# navigate to the NICE toolbox source code folder
cd /path/to/nicetoolbox/

# Activate the environment with LINUX:
source ./envs/nicetoolbox/bin/activate

# Activate the environment with WINDOWS:
envs\nicetoolbox\Scripts\activate

# run the evaluation
run_evaluation
The outputs will be saved to the folder defined in ./configs/evaluation_config.toml under output_folder (with filled-in placeholders). To monitor the experiment, check the log file at /path/to/output_folder/evaluation.log.
Please refer to the tutorial on NICE Toolbox Evaluation for more details about metric selection and summary generation. Under the wiki pages there is an overview of the available metrics to select from. For more data driven analysis based on raw metric results, please check out our evaluation results wrapper tutorial (coming soon) for easy querying, aggregation or export to Pandas Dataframe.
8. Import annotations with NICE Connectors
NICE Connectors let you import human-annotated data from third-party tools into the Toolbox NPZ format, so annotations can be used alongside detector outputs for evaluation or visualization.
Each connector reads a run config TOML from ./configs/connectors/ and is invoked from the toolbox root:
elan_connector import_gaze
For a full walkthrough - including ELAN export format, tier naming conventions, and run config structure - see the ELAN connector tutorial.